LocusZoom.js
A Javascript/d3 embeddable plugin for interactively visualizing and navigating statistical genetic data from customizable sources.
Try LocusZoom.js
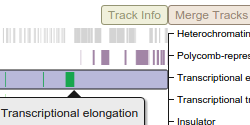
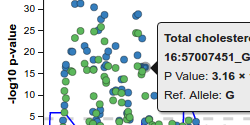
Shown here is a standard interactive LocusZoom plot, depicting GWAS association data with gene tracks loaded from a University of Michigan API. Change the region of the genome in view by scrolling to zoom or dragging to pan, or use some of the links below to jump to top hits for this study by gene. Click around and experiment... LocusZoom.js can do a lot.
Top Hits
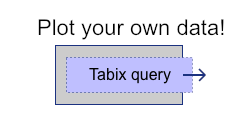
To see other forms of LocusZoom.js in action take a look at https://my.locuszoom.org or the examples on this page. If you are trying to make your own plots but don't want to create a full web server backend, the Tabix Tracks demo provides some useful pointers.
Get LocusZoom.js

To use LocusZoom.js in your application you will need LocusZoom's compiled Javascript and CSS files, and D3.js v5.16.0. We recommend the CDN links below. If you prefer, you may also install the package via NPM and use with any module system that supports ES6 modules or UMD bundles. Source maps are provided for all files.
CSS
All CSS classes are namespaced to avoid collisions. Use
<link crossorigin="anonymous" ...> to ensure that saving images works correctly.
Dependencies
To download or link to past builds of LocusZoom.js use the URL structure above and the version number of your choice. See also: list of past releases .
View source on GitHubDocumentation and Support
Complete LocusZoom.js DocumentationLocusZoom Message Board
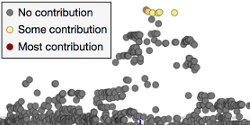
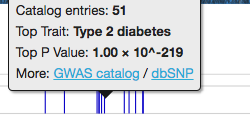
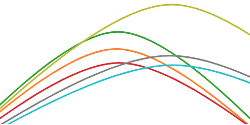
Example Plots
LocusZoom.js is customizable, extensible, and highly flexible. It can work with a wide variety of different types of data. Below are some examples to show some of LocusZoom.js's variability.